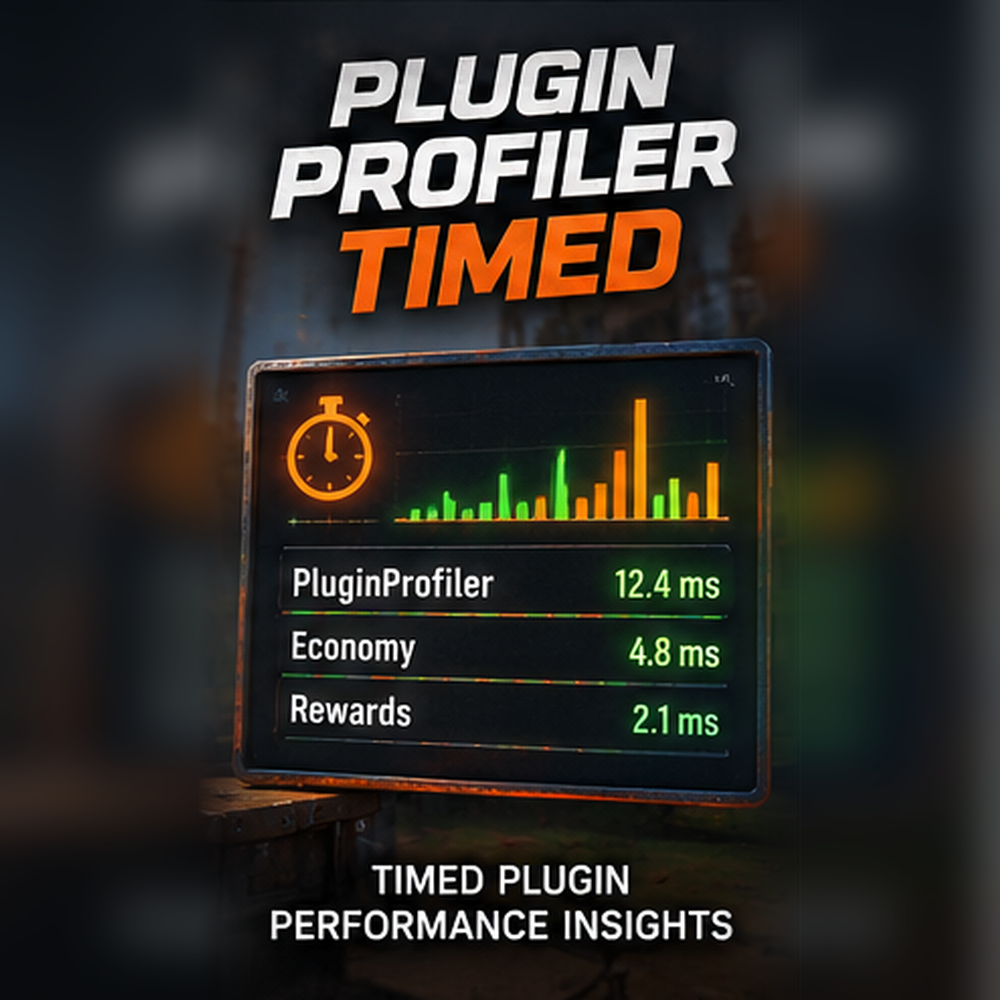
Plugin Profiler Timed
by Base Inspector · v1.0.0 · updated Nov 8, 2026
Profiles plugin hook time only during a timed window started via console. Idle by default (no overhead).
No dependencies: works on its own.
Installs itself with Oxide Sync. Add it to a linked server from My servers. Every future update included. How it works
- Full C# source
- Free updates
- Signed releases
- Oxide / uMod compatible
PluginProfilerTimed — Documentation
Plugin: PluginProfilerTimed
Author: Base Inspector
Version: 1.1.0
Purpose: Profile Oxide plugin hook execution time during a timed window, with optional engine-side diagnostics sampling (FPS estimate, GC, managed memory, entity counts + category breakdown).
What this plugin does
PluginProfilerTimed is a lightweight, “run it when you need it” profiler for Rust servers running Oxide/uMod.
When you start a session (e.g., pp.top 30), the plugin:
- Patches
Oxide.Core.Plugins.Plugin.CallHookvia Harmony. - Measures how long each hook invocation takes (in milliseconds).
- Aggregates results by:
- Plugin name
- Hook name
- Calls, Total time, Max time, and computed Avg time
- Optionally samples diagnostic snapshots every N seconds, including:
- FPS estimate (Unity timing-based)
- Managed memory (GC)
- GC collection counts (Gen0/1/2 deltas)
- Total server entities (fast count)
- An incremental entity scan with category counts (building blocks, turrets, deployables, etc.)
Sessions auto-stop after the time window you specify (or you can stop manually).
Primary benefits
1) Quickly identify “top offenders”
You can get a ranked list of plugins consuming the most total hook time during the window, plus the heaviest hooks inside those plugins.
This is ideal when:
- Server FPS tanks intermittently
- GC spikes occur
- You suspect a plugin is hammering hooks (e.g.,
OnEntityKill,OnTick,OnItemAddedToContainer, etc.) - You want evidence before refactoring/optimizing plugins
2) Correlate plugin time with engine symptoms
The diagnostics summary helps you correlate plugin activity with:
- FPS dips
- Increasing managed memory
- GC collections rising during the sample window
- Entity growth / abnormal categories (e.g., projectile floods, excessive deployables, turrets)
3) Minimal “always-on” overhead
The profiler is idle until started. It only patches and collects data during a session window you control.
How hook timing is measured
This plugin uses Harmony to patch Plugin.CallHook:
- Prefix: records a timestamp when
_running == true - Postfix: computes elapsed time and records it under:
- plugin name (the plugin receiving the hook)
- hook name
- measured ms
Metrics tracked per hook:
CallsTotalMsMaxMs
Diagnostics sampling (engine-side indicators)
During a session, diagnostics are captured every diagInterval seconds:
Captured fields
Per sample:
- t: seconds since session start
- fps~: estimated FPS (
1 / Time.unscaledDeltaTime) — trend indicator, not a perfect metric - mem: managed memory from
GC.GetTotalMemory(false) - GC(0,1,2): collection deltas since session start
- entities:
reportedTotal: fast count (BaseNetworkable.serverEntities?.Count)counted: counted during the incremental scan
- Category breakdown from incremental scan:
- Building blocks
- Deployables (heuristic category)
- Storage
- Turrets
- Traps
- Vehicles
- NPCs
- Animals
- IO / Industrial
- Dropped items
- Projectiles
Why the scan is incremental
Enumerating all server entities can hitch on large servers. This plugin scans in batches (_scanBatchSize = 2500) and continues on subsequent ticks to reduce spike risk.
Commands
These are console commands (
[ConsoleCommand]). That means they’re intended for:
- Server console
- RCON console
- Admins with console access
Players cannot run these via chat unless you build a wrapper command.
pp.top <seconds> [diagIntervalSeconds]
Runs a timed profiling session and prints the results when complete (no dump file by default).
Defaults
seconds: 30diagIntervalSeconds: 5
Examples
pp.top
Runs 30s, diag every 5spp.top 45
Runs 45s, diag every 5spp.top 30 10
Runs 30s, diag every 10s
pp.dump <seconds> [diagIntervalSeconds]
Runs a timed profiling session and writes a dump file at the end.
Defaults
seconds: 60diagIntervalSeconds: 5
Examples
pp.dump
Runs 60s and writes dumppp.dump 120 5
Runs 120s and writes dump
pp.diag <seconds> [diagIntervalSeconds]
Runs a timed session and always writes a dump file, emphasizing diagnostics.
Defaults
seconds: 120diagIntervalSeconds: 5
Examples
pp.diag
Runs 120s and writes dumppp.diag 180 10
Runs 180s, diag every 10s, writes dump
pp.stop
Stops the current session early (no dump file unless you used pp.diag which forces a dump on completion).
Example
pp.stop
pp.hooks <PluginName>
After a session ends, prints the top hooks for a specific plugin from the last session.
Example
pp.hooks Loadoutspp.hooks BetterChat
Session limits & clamping behavior
To keep profiling safe and predictable, the plugin clamps values:
Duration (seconds)
- If
<= 0:
defaults to 30 (or 60 fordump, forced fordiag) - Max: 600 seconds (10 minutes)
Diagnostics interval (diagIntervalSeconds)
- If
<= 0: default 5 - Min: 2
- Max: 60
Output overview
When a session ends, you get:
1) Session header
Includes:
- reason ended (timer elapsed / manual stop / unload)
- elapsed seconds
- number of plugins tracked
- number of diag samples
2) “Top plugins by total hook time”
Shows up to 12 plugins, ordered by total hook time over the window.
For each plugin:
- total time
- calls
- average time per hook call
- top 5 hooks by total time for that plugin (hook-level totals + max)
3) Diagnostics summary
Includes:
- fps~ min/avg/max (estimate)
- managed memory start/end/delta
- GC collection deltas
- entity counts + category breakdown
- “worst sample” line for lowest fps snapshot
4) Dump file (when using pp.dump or pp.diag)
A text file is written to:
oxide/logs/PluginProfilerTimed_YYYYMMDD_HHMMSS_<seconds>s.txt
The dump contains:
- full plugin totals + all hooks (not just top 5)
- all diagnostic samples (one per line)
- diagnostic summary
Permissions & access control
This plugin does not register or check Oxide permissions.
Access is effectively controlled by:
- who can run console/RCON commands
If you want explicit Oxide permission control (recommended if you add chat commands later), you’d add something like:
permission.RegisterPermission("pluginprofilertimed.use", this);- validate in command handlers
But as-is, no permissions are defined.
Practical usage patterns
“Find the culprit plugin”
- Trigger the lag/fps issue (or wait for it).
- Run:
pp.top 30 5
- When it stops, look at:
- top plugin by total ms
- top hook(s) inside that plugin
- Then run:
pp.hooks <ThatPluginName>
- Repeat with a longer window if needed:
pp.dump 120 5
“Capture evidence for later analysis”
Use:
pp.dump 180 5
Then archive the dump file and compare runs after you change:
- plugin versions
- plugin configs
- entity cleanup rules
- map wipes
“Diagnose entity/GC problems”
Use:
pp.diag 300 10
You’ll get:
- a dump file automatically
- a better story about memory/GC and entity category distribution over time
Performance & safety notes
- Hook timing adds overhead because every CallHook is measured while running.
- Keep windows short (30–120s) unless necessary.
- Diagnostics entity scanning is incremental to reduce hitching.
- If you still see hitches, consider lowering
_scanBatchSizein the plugin code.
- If you still see hitches, consider lowering
- FPS is an estimate and can be noisy; use it as a trend signal, not a strict benchmark.
- This profiler is best used in combination with:
- Carbon profiler dumps (if you run Carbon)
- server FPS graphs
- entity counts / kill metrics
- plugin-specific debug logs
Installation
- Save the plugin as:
oxide/plugins/PluginProfilerTimed.cs
- Ensure your server supports Harmony patching (this plugin references
HarmonyLib). - Reload:
oxide.reload PluginProfilerTimed
- Verify console shows:
- “Loaded. Idle until you run: pp.top …”
Troubleshooting
“Profiler could not patch CallHook”
This means the plugin couldn’t find Oxide.Core.Plugins.Plugin.CallHook or Harmony patching failed.
Check:
- Oxide/uMod version compatibility
- Harmony availability in your server environment
- server logs for the printed error:
- “Failed to find Oxide.Core.Plugins.Plugin.CallHook. Cannot profile.”
“No plugin data collected”
If the server was idle, or hooks were not firing during the window, totals may be empty.
Try:
- run during a known busy time (raids, large PvP, wipe events)
- increase duration:
pp.top 90 5
Command quick reference
| Command | What it does | Writes dump? |
|---|---|---|
pp.top <sec> [diag] | Profile and print summary | No |
pp.dump <sec> [diag] | Profile, print summary, save dump | Yes |
pp.diag <sec> [diag] | Diagnostics-focused run, always saves dump | Yes (forced) |
pp.stop | Stop early | No |
pp.hooks <PluginName> | Show top hooks for plugin from last session | N/A |
Example output snippet (what to look for)
You’ll typically see lines like:
SomePlugin | total=1234.56ms | calls=98765 | avg=0.012500ms- OnTick | total=900.00ms | calls=60000 | max=4.20ms
Red flags
- Extremely high call counts on frequent hooks (
OnTick,OnServerTick,OnPlayerTick) - High max times (spiky hitches) on hooks like
OnEntityTakeDamage - Large GC deltas + rising managed memory during the same window
- Abnormal entity categories (projectile floods, dropped items explosion, etc.)
Notes for future enhancements (optional)
If you decide to extend this plugin later, common upgrades include:
- Add chat commands for admins
- Add Oxide permission checks
- Allow toggling diagnostics on/off per session
- Export CSV/JSON for automated analysis
- Add filters (only track specific hooks/plugins)
pp.diag <seconds>—pp.dump <seconds>—pp.top <seconds>—pp.hooks—pp.stop—
v1.0.0Feb 23, 2026Latest
Timed diagnostics sampling during the session (default every 5s)
Server FPS estimate (from Unity delta timing)
GC collection deltas (Gen0/1/2) and managed memory
Entity realm scan (incremental, batched so it won’t freeze) that counts:
total entities
building blocks
deployables
storage
turrets/traps
vehicles
NPCs / animals
IO / industrial / electrical-ish entities (approx)
dropped items / projectiles (if present)
AI “active” counts (approx via NPC categories) to catch runaway spawns
v1.0.0Feb 23, 2026
Initial release